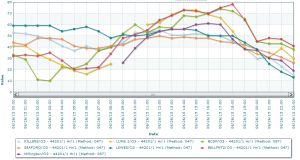
Daily 8-hour average ozone unexpectedly reached the upper Moderate range in northern Delaware on Friday, June 26. The observed maximum 8-hour value was 70 parts per billion (ppb), but we forecasted 50 ppb, for a substantial under-forecast of 20 ppb. Figure 1 shows ozone beginning to rise around 9 am EDT Friday and continuing to rise throughout the day until 8 pm EDT Saturday. Hourly mixing ratios did not start decreasing significantly until the evening hours.
Figure 1. Hourly ozone mixing ratios, in parts per billion (ppb), for Delaware on Friday, June 26, 2015. The red line represents the monitor in Bellefonte, DE, which is the monitor that recorded a daily max 8-hour ozone mixing ratio of 70 ppb. The time along the x-axis is shown in EST, and is offset by two hours. For example, the time stamp of 11:00 represents 1 pm EDT.
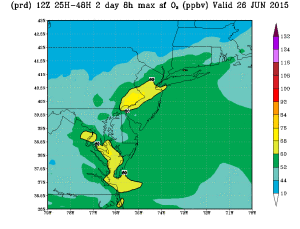
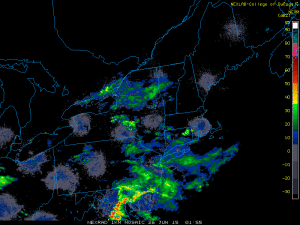
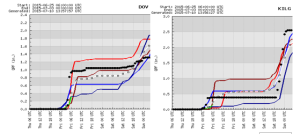
We forecasted Good ozone on Friday in response to widespread clouds and precipitation associated with a stalled frontal boundary in the southern Delmarva and a clean persistence forecast. Most of the air quality model guidance was showing Good ozone throughout Delaware on Friday, with the 12Z NOAA model being the exception. The NOAA model was predicting mid to upper Moderate ozone in northern Delaware, but we deemed its forecast as an outlier (Figure 2). There was high confidence that widespread thunderstorms Thursday evening would clean out the atmosphere of ozone precursors for Friday. Figure 3 shows the heavy precipitation observed on radar Thursday evening. The bulk of the precipitation reached Delaware around 10 pm EDT Thursday as it moved from west to east. The heaviest precipitation was observed in southern Delaware, suggesting that the atmosphere in areas to the north, such as Bellefonte, did not clean out as much as areas to the south. Figure 4 shows the observed precipitation in Dover and Wilmington, respectively. Dover, in central Delaware, observed almost .5 inches more rainfall than Wilmington, in northern Delaware.
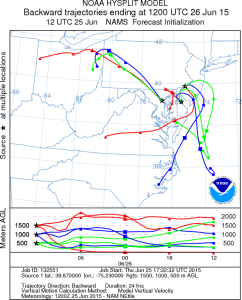
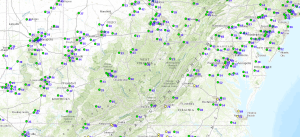
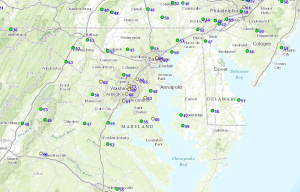
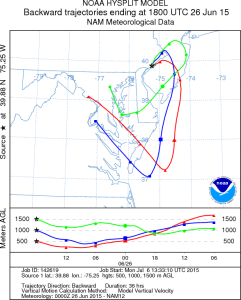
Forecast back trajectories ending at Philadelphia for Friday were showing slight low level onshore transport (Figure 5). Air from offshore locations would have been clean, resulting in a fairly clean residual layer. Our persistence forecast was based on hourly surface observations at 1pm EDT. At this time, many monitors in the area were observing ozone in the upper 40’s to low 50’s ppb, with a few monitors reaching the low 60’s ppb (Figure 6). We put confidence in the persistence forecast, thinking that the transport of the clean air would keep ozone in the Good range in Delaware on Friday. However, our persistence forecast ended up not being very accurate. Hourly surface ozone mixing ratios quickly began to rise after 1 pm EDT, reaching the upper 60’s to low 70’s ppb at 2pm EDT in some locations (Figure 7). Figure 8 shows analyzed back trajectories, ending at Philadelphia at 8 am EDT and 2 pm EDT, respectively. The analyzed back trajectories were different from the forecast trajectories, showing low level transport from the DC Metropolitan area and transport aloft from the Ohio River Valley. These trajectories suggest that there were high concentrations of ozone precursors in the residual layer over Delaware on Friday.
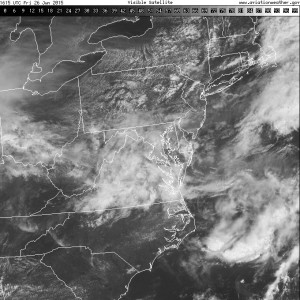
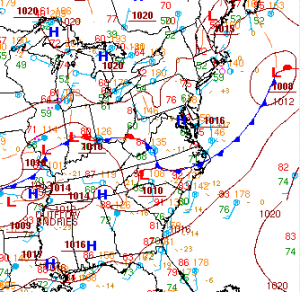
The lack of clearing in northern Delaware and transport of polluted air would not have mattered since overcast skies were expected, effectively shutting down substantial ozone production. Figure 9 shows the widespread cloud cover over the Mid-Atlantic region early Friday afternoon, but there were pockets of clearing over and around northern Delaware. Having just passed the summer solstice, the solar zenith was fairly close to its maximum. This suggests that there was enough sunlight in throughout the day to continue ozone production. If clouds were as thick as they were in Virginia at the time, then ozone production would have likely been limited. In Figure 10, WPC analyzed a center of high pressure over the Chesapeake Bay at 5 pm EDT Friday. The light winds in late afternoon and evening associated with this weak center of high pressure likely contributed to a buildup of ozone in northern Delaware, leading to the small spike in hourly ozone mixing ratios at the Bellefonte monitor in the late afternoon.
Looking back on our forecast, we feel that we put a lot of confidence in the factors limiting ozone production. The forecasted heavy precipitation did not clean out the atmosphere as expected, leading to a more polluted residual layer. Forecast back trajectories were showing clean transport into the region, but we didn’t notice the converging nature of the back trajectories in DC, Dover, and Philadelphia. The late day clearing coupled with long lasting Friday traffic emissions heightened our error even more. We should have been more cautious and banked on the possibility that one, if not all, of these ozone limiting factors would not have verified.
Figure 2. 8-hour average ozone forecast guidance for Friday, June 26 from the 12Z run of the NOAA/EPA model.
Figure 3. Composite radar reflectivity on the evening of June 25, 2015.
Figure 4. The black dots represent the observed precipitation, in inches, at Dover, DE and Wilmington, DE from Thursday 2 am EDT to Sunday 12 am EDT.
Figure 5. Forecast back trajectories from NOAA’s HYSPLIT Model for Philadelphia, ending at 8 am EDT June 26, 2015.
Figure 6. Observed ozone mixing ratios at 1 pm EDT on June 25, 2015 across the Central Mid-Atlantic.
Figure 7. Observed ozone mixing ratios at 2pm EDT on June 25, 2015 in the DC Metro and Baltimore region.
Figure 8. Analyzed back trajectories from NOAA’s HYSPLIT Model for Philadelphia, ending at 2 pm EDT June 26, 2015.
Figure 9. Visible satellite image of the Mid-Atlantic valid at 1215 pm EDT June 26, 2015.
Figure 10. Surface analysis by the WPC at 5 pm EDT with a weak center of high pressure analyzed over the Chesapeake Bay.


