

The long Western drought and the recent extremely hot and dry weather have resulted in widespread wildfires from Alaska, through the Pacific Northwest, and into Canada. At this time, smoke from a group of wildfires centered in northern Alberta have begun to push southward into the United States.
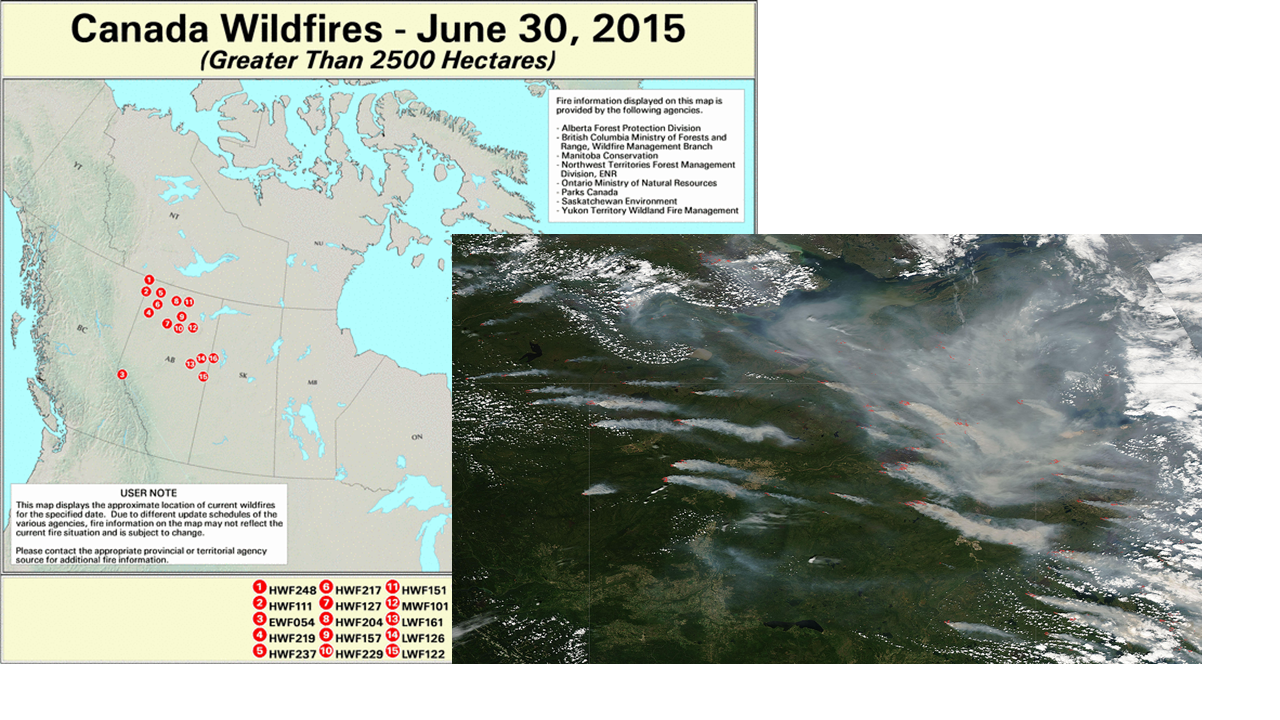 Figure 1. Map of wildfire locations in Canada, courtesy of the Active Fire Mapping Program, http://activefiremaps.fs.fed.us/ (upper left). Visible image of northern Alberta from MODIS aboard Aqua, June 28, 2015 (lower right).
By yesterday, Monday, June 29, the smoke plume can be clearly seen across the upper Midwest (Figure 2). The questions of most interest are the future direction of the smoke and whether it will mix downward to the surface. Smoke plumes from strong wildfires are typically lofted upward near their source and may remain well aloft, not interacting with the surface, for long periods. As of this morning, surface PM2.5 observations show that some of the smoke has impacted ground level observations sites (Figures 3 and 5). The future path of the smoke is related to the large scale weather pattern which features a trough of low pressure over the eastern US (Figure 4). This means that the smoke in the upper Midwest will move in a counter-clockwise arc towards the east. Upward motion over the Ohio River Valley and northward should keep the smoke well above the surface, but this cannot be said for areas of smoke that drift further south. This analysis suggests that smoke will impact the southeastern US on Wednesday and perhaps the mid-Atlantic on Thursday.
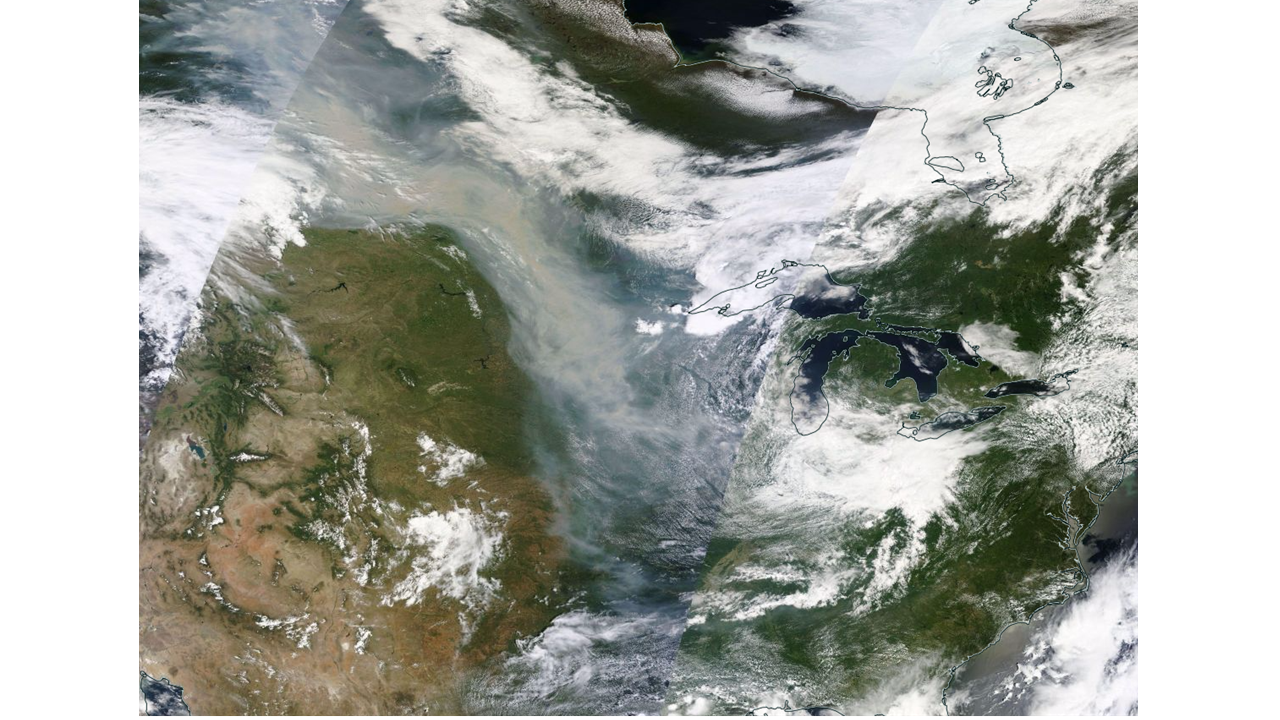
Figure 2. Visible satellite image from June 29, 2015.
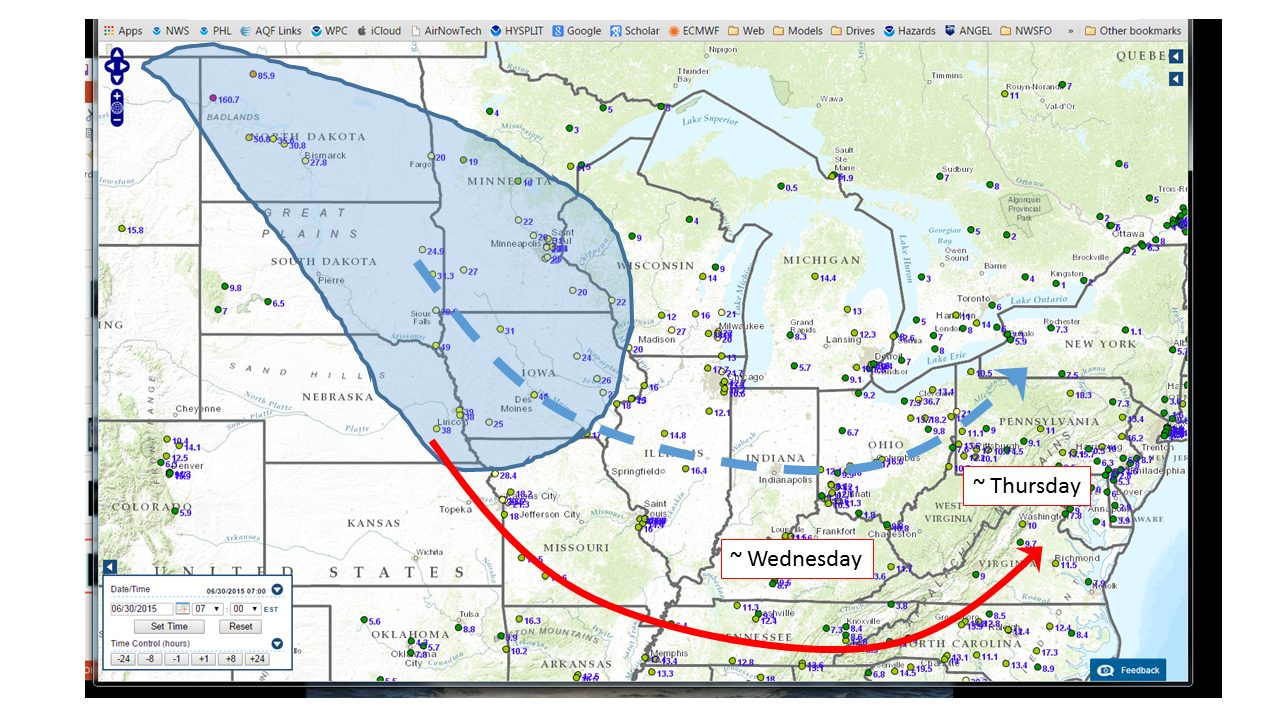
Figure 3. AirNow Navigator PM2.5 observations, June 30. Blue shaded area is the area of fire smoke currently observed by surface-based PM2.5 monitors. The arrows are rough estimates of the expected track of the smoke plumes. The dashed line tracks the northern path where upward motion is expected. The red line tracks the southern path characterized by less upward motion and more likely surface impacts.
Figure 4. 500 mb geopotential heights, winds and humidity, June 30, 2015. Winds are roughly parallel to the isoheight lines.
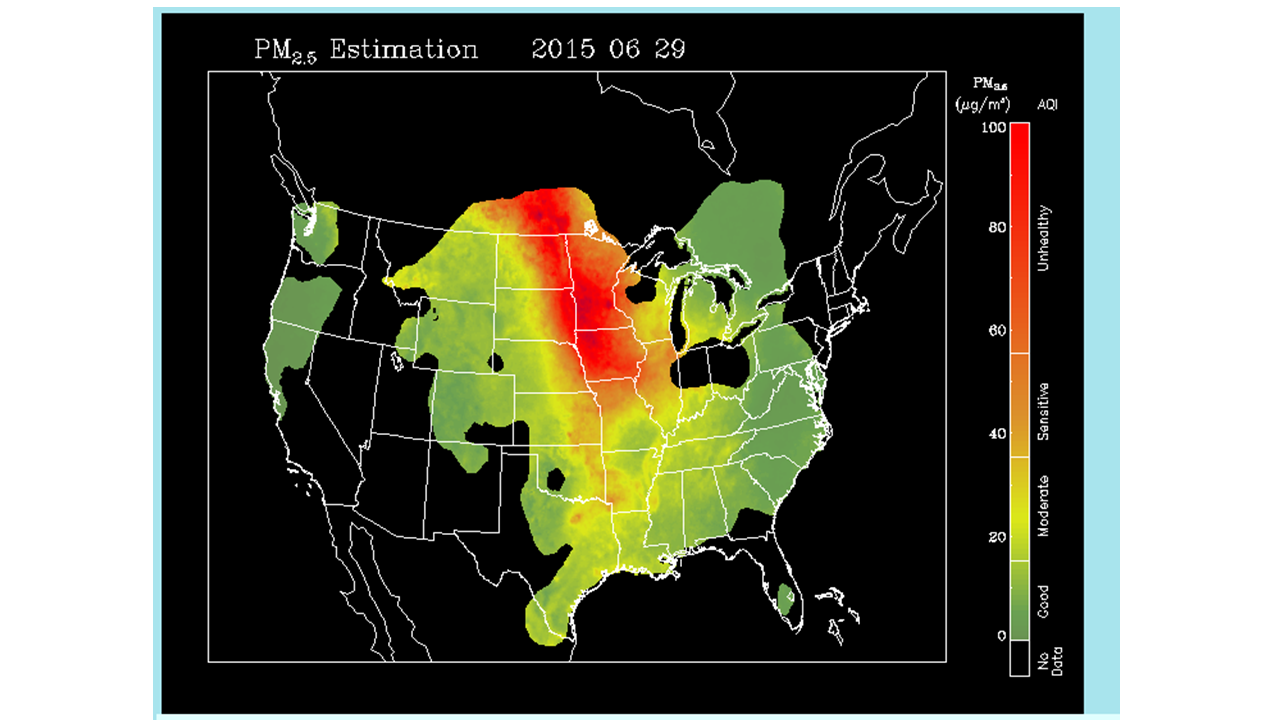
Figure 5. Satellite estimated PM2.5 concentrations, June 29, 2015. http://www.star.nesdis.noaa.gov/smcd/spb/aq/index.php?product_id=2