

Ozone exceeded the 70 ppbv NAAQS in an isolated area of northeastern PA (one monitor) and central NJ (2 monitors) on Wednesday, June 15 (Figure 1). The exceeding Philadelphia forecast region monitor was Bristol, at 75 ppbv for the 8-hr average; in NJ, the Rider University and Colliers Mills monitors both just exceeded at 71 ppbv for the 8-hr average. This isolated area of USG ozone was courtesy of localized and recirculating back trajectories (Figure 2), calm surface winds, and essentially full afternoon sunshine (Figure 3). This combination was sufficient, in conjunction with Philadelphia metro area emissions, to push ozone into the USG range.
What is interesting (and troubling) about this event is that it wasn’t what we consider “hot enough” for USG ozone – high temperatures only reached 83 °F at KPNE, the closest ASOS station to Bristol, while maximum temperature was 79 °F at KPHL (Figure 4). Historically, we don’t see USG ozone along the I-95 Corridor until temperatures reach a minimum of 85 °F on the urban scale. The temperature gradient between KPNE and KPHL was due to a line of clouds that covered Delaware and the southern and western portions of the Philly metro area (Figure 3), but didn’t extend far enough to the north to cover the Bristol monitor. We expected these clouds, but we thought they would cover the entire Philly forecast area (Figure 5) and keep ozone in the upper Moderate range. The other interesting (and troubling) aspect of this exceedance was that, for the second time this season, ozone went from Good to USG the next day. The observed 8-hr ozone maximum in Philadelphia on June 14 was 54 ppbv. It used to be extremely rare to go from Good to USG ozone in 24-hours, but it’s become increasingly common in Philadelphia in the past couple of years. So once again, we can’t rely on persistence as a forecast tool. We knew the air mass was going to be somewhat stagnant, but it was relatively clean on June 14, with estimated upwind persistence in the mid-50s ppbv for the 8-hr average. Typically, we look for upwind persistence in the mid-60s to 70s ppb for the 8-hr average at a minimum to get us to USG in Philly, in conjunction with local ozone production.
Once again, the air quality models did not pick up on this event. The NOAA model guidance (Figure 6), as a representative example, sort of had a bulls-eye of Moderate ozone in the correct place in central NJ, but the magnitude was low, and the other bulls-eye in the DC/BAL area was much too high and didn’t verify.
So far this season, we haven’t been able to rely on any of our usual forecasting “tools” to predict USG ozone. This event demonstrates that temperature isn’t very reliable anymore, and persistence has been a weak forecast variable all season (and last season too). The air quality models aren’t even helping us. So where do we go from here? In retrospect, given the information I had on Tuesday afternoon, I would not have been justified in issuing a USG forecast for Philadelphia for Wednesday. However, on Wednesday morning, it was obvious that the air mass was modified, with a lot of NOx titration, and I could see the line of clouds was not reaching over the northern suburbs, as expected. At that point, I could have updated the forecast to USG, but we don’t have a mechanism in place in PA to do so. I think it’s time for us as a community of Mid-Atlantic forecasters to consider being able to issue morning updates to our forecasts. I brought this idea up with some colleagues last year, and it’s fraught with complications, especially in the Washington, DC metro region, since AQA alerts trigger actions related to transportation and health across multiple state and local jurisdictions. As a result, enacting or cancelling an AQA “the day of” (instead of the day before) does not provide enough lead time for transportation/health actions and warnings/messaging (like on highway signs). But given the increasingly localized nature of emissions across the region, and the growing importance of mesoscale weather features, not synoptic, for air quality conditions, it’s becoming clear that we often can’t accurately predict ozone levels the day before.
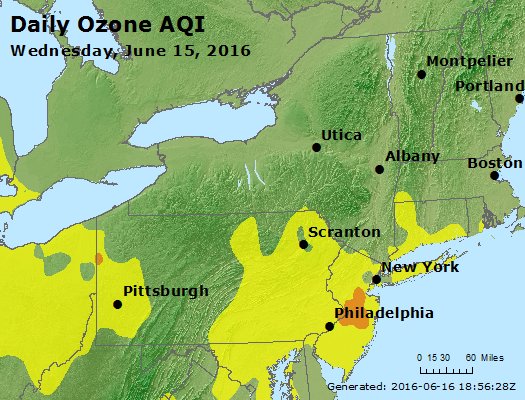
Figure 1. Observed ozone AQI values for Wednesday, June 15.
Figure 2. 24-hour back trajectories ending at KPHL on June 15 at 12 UTC.
Figure 3. GOES visible satellite image for June 15 at 19 UTC.
Figure 4. WPC surface analysis with station data for June 15 at 18 UTC.
Figure 5. Clouds and precipitation guidance from the 12 UTC run of the 4 km NAM for June 15 at 23 UTC.
Figure 6. 8-hr average maximum ozone guidance for June 15 from the 12 UTC run of the NOAA model on June 14.