

According to the Mt Holly National Weather Service (NWS) Office, August 2016 was the warmest August in Philadelphia, based on records dating back to 1874, with an average high temperature of 81.1 °F, which is almost 4 °F higher than the 30-year normal of 76.6 °F. In August, KPHL had 17 90 °F days, compared to a mean of 5 days, while KILG had 15 90 °F days, also relative to a mean of 5 days. Despite this record warmth, and plenty of sunshine, there was only one ozone exceedance day this month in Delaware (August 27 – see my previous post) and only one in Philadelphia – yesterday, August 31. This underscores the breakdown in the relationship between hot weather (90 °F days) and high ozone in the past ~4 years: we still need very warm to hot weather (Tmax ≥ 85 °F) for high ozone, but only a small fraction of all hot days are exceedance days. The hard part is determining which of the many hot and sunny days will be conducive for high ozone.
After getting a rough start forecasting the 2016 ozone season, we acclimated in August, with no false alarms or missed forecasts, and a forecast hit for the 31st. I had lower than normal confidence in the forecast for the 31st, but a variety of ozone-conducive factors were in place. The region was pre-frontal, with a strong cold front approaching from the northwest. Clouds and thunderstorms associated with the advancing front were expected to hold off through the late afternoon, keeping Philadelphia under full sun, which verified (Figure 1; click on figures to enlarge). At the same time, Tropical Depression Nine was lurking off of the coast, southeast of the Delmarva. The National Hurricane Center had expected to TD9 to strengthen into Tropical Storm Hermine, but it did not. A nearby tropical cyclone can be tricky for air quality forecasts because strong subsidence ahead of the storm can enhance ozone formation, as long as the cyclone is not so close that its clouds or tropical air impact the forecast area. I had been concerned that a possible TS Hermine might provide a boost of subsidence for locations along the I-95 Corridor, but the weaker TD9’s subsidence ended up being concentrated offshore (Figure 1).
It turned out that there was enough afternoon sun and surface convergence from weak southwesterly winds along I-95 (Figure 2) for the four most northwesterly monitors in the Philadelphia forecast area to exceed, with a maximum observed 8-hour average of 80 ppbv at the Bristol and Northeast Airport monitors. Two monitors in the Baltimore metro area also exceeded, as well as several in southwestern CT. There was enough onshore flow to keep the northern Delaware monitors in the upper Moderate range, as forecasted, as well as most of NJ, with only the Camden monitor, located just across the river from Philadelphia, recording an exceedance. So most of the forecasts for the day verified (Figure 3), which was a great way to close out the month.
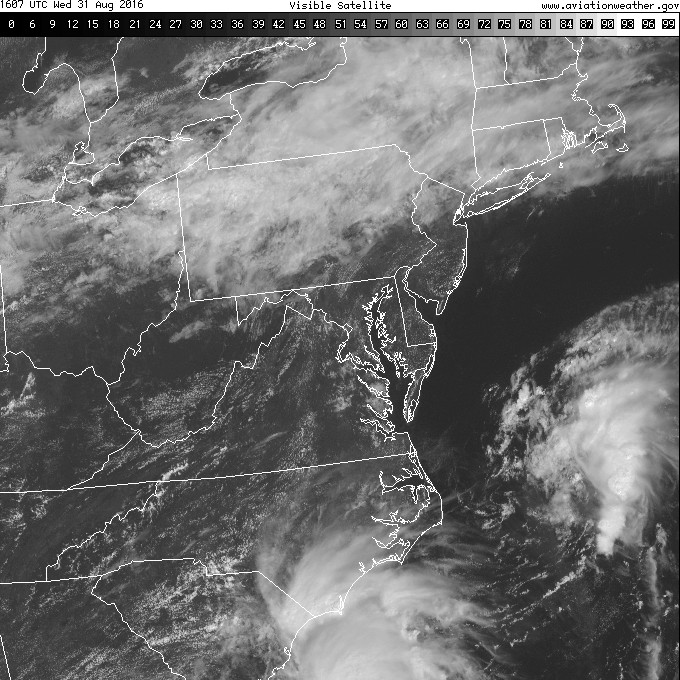
Figure 1. GOES visible satellite imagery for the Mid-Atlantic at 1607UTC on August 31, 2016
Figure 2. METARS surface analysis for the Mid-Atlantic for 1628 UTC (left) and 2225 UTC (right).
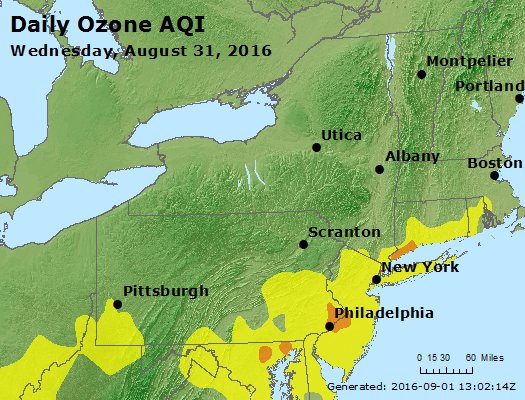
Figure 3. Forecasted ozone exceedance regions (left) and observed exceedances (right) for August 31, 2016.