

Ozone unexpectedly exceeded the daily NAAQS of 70 ppbv on Saturday at two monitors in Wilmington, DE: MLK (73 ppbv) and Bellefonte (71 ppbv). The only other monitor along the I-95 Corridor that exceeded was the nearby Fair Hill, MD monitor (75 ppbv). Figure 1 shows the daily ozone AQIs for the region (click on individual figures to enlarge).
The exceedances were a surprise because the region was post-frontal (Figure 2), with what had seemed on Friday to be a relatively clean air mass in place. I think that was true, given the essentially isolated nature of the exceedances. The NOAA model guidance for Saturday (Figure 3) had indicated the possibility for ozone exceedances along the Fair Hill-Wilmington-Chester stretch of I-95, but the NOAA model had been over-forecasting consistently for the past three weeks, and the other air quality models predicted Moderate ozone, so I undercut the guidance. That was the right call for Chester, where daily ozone only reached 66 ppbv (right in line with my forecast of 65 ppbv), but not in Wilmington.
So what went wrong? There was a strong ridge in place (Figure 4), with the center directly overhead, which promoted stagnation. It was sunny all day (Figure 5), with temperatures reaching 91 °F at KILG, and slightly lower humidity than in recent days (dew points were hovering around 60 °F at KILG). Surface winds were light all day and recirculated from the north in the morning (Figure 6a) to the east/southeast (Figure 6b) in the afternoon. I think the two Wilmington monitors (and the Fair Hill monitor) were in a “sweet spot” of surface convergence that kept I-95 highway emissions localized enough to promote abundant sustained afternoon ozone production. The exceeding monitors had fairly steady high hourly ozone from 2 PM all the way through 7 PM, whereas hourly ozone values at neighboring monitors were either slower to rise or quicker to drop off.
I’m not sure what I could have realistically done differently with the forecast. In my many years of forecasting for the Mid-Atlantic, I can’t recall ever seeing a situation like we had on Saturday – in which two Wilmington monitors exceeded but not any in Philadelphia, under afternoon onshore flow (albeit light) and absent any strong mesoscale convergence feature like a weak frontal boundary or sea breeze. Part of it is inexperience with the new ozone standard – Saturday would not have been an exceedance day under the previous daily NAAQS of 75 ppbv. I will also have to remember that light northerly flow aloft with recirculating surface winds, like we had on Saturday, can be an issue for northern Delaware, particularly with a mid- or upper-level ridge overhead.
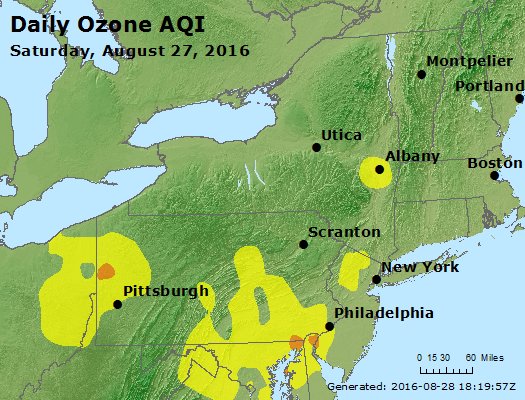
Figure 1. Daily peak ozone AQI values for Saturday, August 27.
Figure 2. WPC surface analysis for 18 UTC on August 27, showing a stalling cold front well south of the Delaware forecast region.
Figure 3. NOAA-EPA model guidance for August 27.
Figure 4. 500 mb analysis for 12 UTC on August 27.
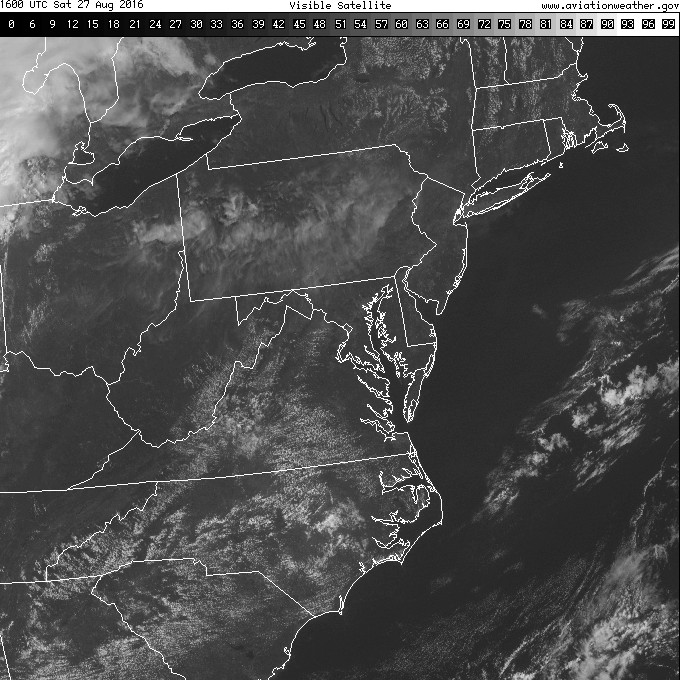
Figure 5. GOES visible satellite imagery for the Mid-Atlantic at 16UTC on August 27.
Figure 6. METARS surface analysis for the Mid-Atlantic for 1255 UTC (a) and 1625 UTC (b)