

Beginning in 2013 and continuing into 2015 and 2015, there has been a “step-down” in peak observed ozone (O3) across the Mid-Atlantic region. As shown in Figure 1, the number of O3 exceedance days (observed 8-hour average O3 ≥ 76 ppbv) in the southeastern Pennsylvania forecast region (SEPA, which includes Philadelphia) dropped substantially in 2013-2015 compared to 2003-2012. The black horizontal lines in Figure 1 indicate the average number of days when observed 8-hour O3 was ≥ 76 ppbv during the periods 1997-2002 (39.3 days), 2003-2012 (19.0 days), and 2013-2015 (5.0 days). The initial “step-down” during the period 2003-2012 has been attributed to reductions in O3 precursors, primarily emissions of nitrogen oxides (NOx) from energy generating units (EGUs) in the eastern U.S associated with the so-called “NOx SIP Rule.” Another, temporary “step-down” in O3 precursor emissions and concentrations occurred during the Great Recession in 2009, when only 3 O3 exceedance days were observed in SEPA.
What is responsible for the recent “step-down” in observed O3? Meteorology likely plays a role. The Mid-Atlantic had a somewhat atypical weather pattern during the summers of 2013-2015, which limited the development of heat waves in June-August. Historically, most high O3 days in the Mid-Atlantic region were characterized by a “heat wave” synoptic weather pattern, featuring a “ridge” of high pressure aloft, slowly eastward migrating surface high pressure, westerly transport aloft from the Ohio River Valley, sunny skies, and maximum temperature (Tmax) ≥
90 °F. Fewer incidences of “heat wave” synoptic patterns in June-August for the past three summers have presumably impacted peak observed O3 levels. But a quick comparison of the total number of hot days (Tmax ≥ 90 °F), days with measureable precipitation, and O3 exceedances for the periods 1997-2002, 2003-2012, and 2013-2015 in SEPA suggests that weather is not the sole contributing factor to the recent “step-down” in observed O3. Figure 2 shows that the average number of days with Tmax ≥ 90 °F was essentially constant for the three periods (25-27 days), while the average number of days with measureable precipitation was roughly the same in 1997-2002 (45) and 2013-2015 (47) – slightly less than the average for 2003-2012 (52). In contrast, the average number of O3 exceedance days dropped from 39 in 1997-2002 to 19 in 2003-2012 (attributed to reductions in regional NOx associated with the NOx SIP Rule) to only 5 in 2013-2015. Thus, even though the overall synoptic weather pattern was somewhat atypical during June-August 2013-2015, there were a comparable number of hot and rain-free days compared to previous years. Based on these weather conditions alone, observed O3 during 2013-2015 would have been expected to be similar to previous years. But it was not – and research shows that upwind NOx emissions have been steadily declining in recent years. Thus, lower regional NOx emissions seem to be the primary driver of the recent “step-down” in observed O3.
So what can we expect from the 2016 O3 season? One thing seems certain – we will have more O3 exceedance days than previous years because U.S. EPA lowered the O3 National Ambient Air Quality Standard (NAAQS) from 75 to 70 ppbv. We estimate that this change will increase the number of exceedance days in SEPA by 2.5 to 3 times, relative to 2013-2015. So for example, in 2015, there were 18 days with observed 8-hour O3 ≥ 71 ppbv, compared to 8 days with observed 8-hour O3 ≥ 76 ppbv. If it’s an unusually hot and dry summer, we may see even more O3 exceedance days. So far, after a rash of early season exceedances across parts of western Pennsylvania and Virginia during late April, it’s been cool, rainy, and cloudy during the first three weeks of May. Climatologically, that should change as we close out May and move into the warmer days of June, when we expect O3 will be on the rise.
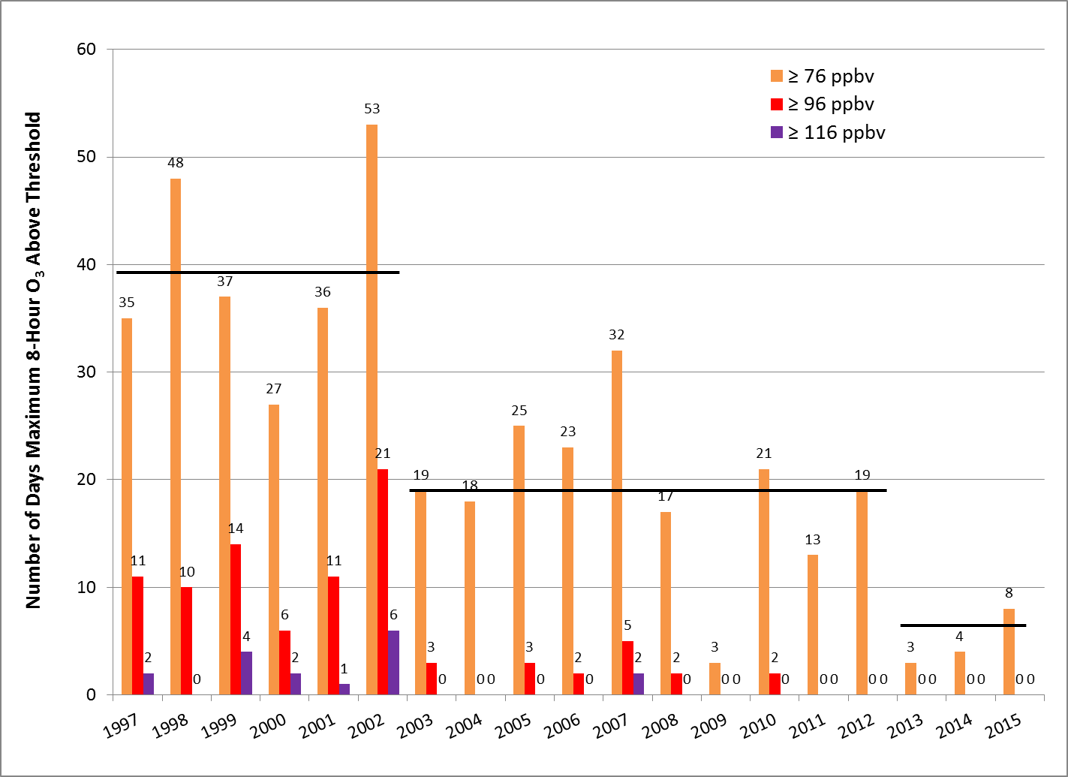
Figure 1. Number of days when maximum observed 8-hour O3 exceeded thresholds of 115 ppbv (purple bars), 95 ppbv (red bars), and 75 ppbv (orange bars) in SEPA for 1997-2015. The black lines indicate the average number of days with observed 8-hour O3 ≥ 76 ppbv for the period 1997-2002 (39.3 days), 2003-2012 (19.0 days), and 2013-2015 (5.0 days).
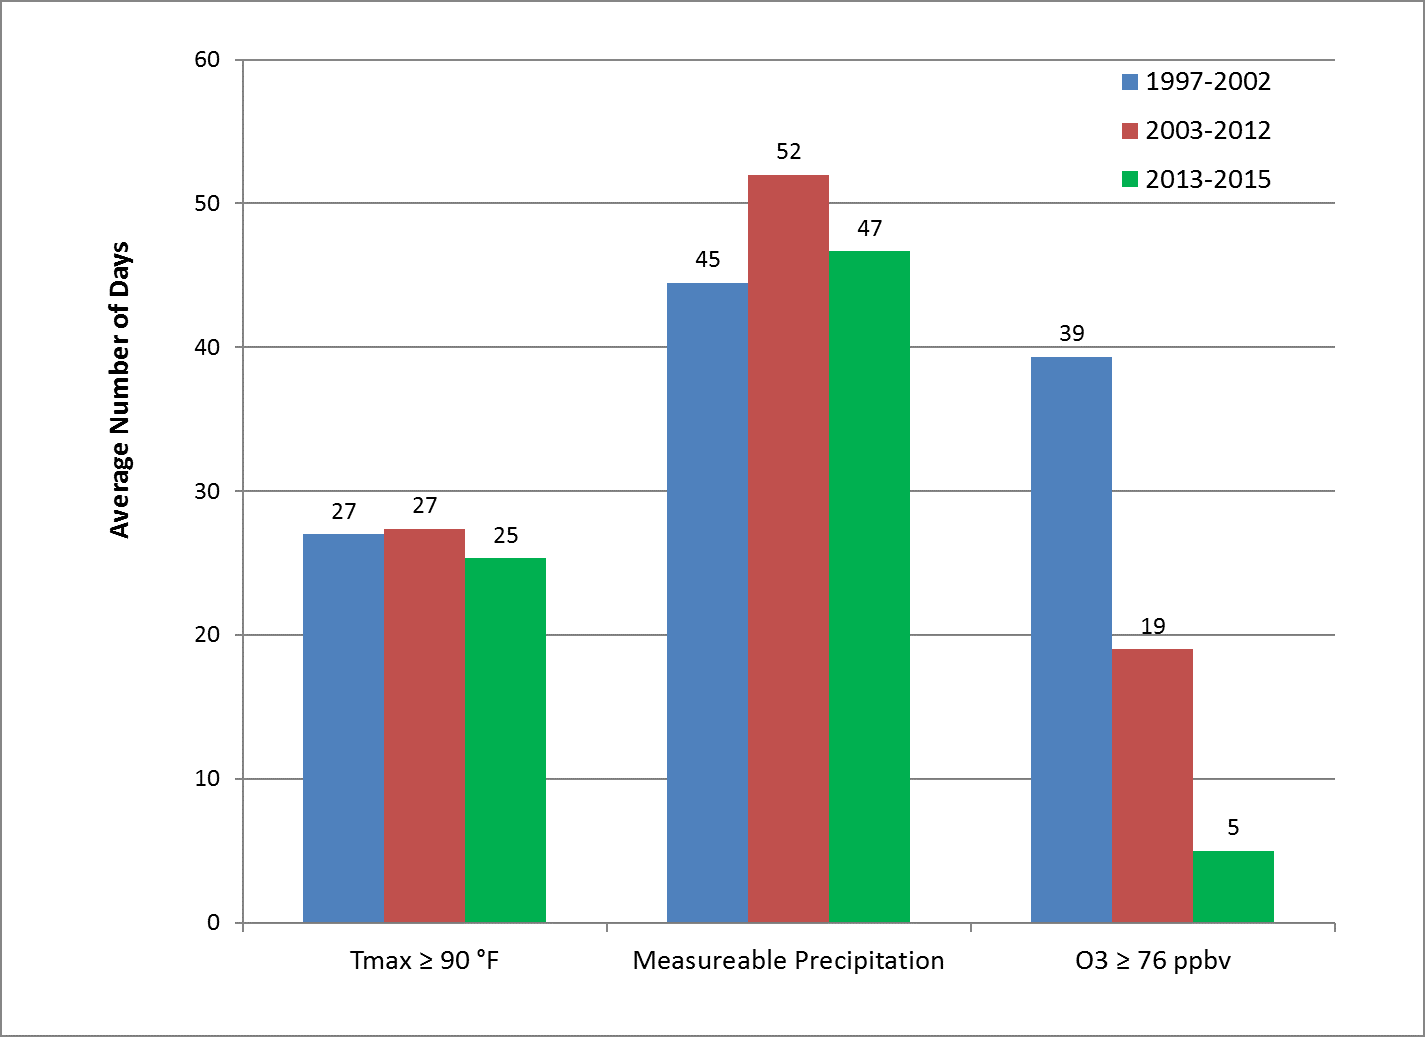
Figure 2. Average number of days with Tmax ≥ 90 °F and measureable precipitation at KPHL, and observed 8-hour O3 ≥ 76 ppbv in SEPA for May 1 to September 30 during the periods 1997-2002 (blue bars), 2003-2012 (red bars), and 2013-2015 (green bars).