Now that we are almost 80% of the way through the 2016 ozone season, it seems like a good time to check in and see how things are progressing. Back on May 20, I wrote a post on the outlook for the 2016 season. We were very interested to see how this year’s ozone season would stack up to the previous three seasons, during which we saw a sudden and very dramatic decrease in observed ozone levels compared to the period 2003-2012. Based on this recent downward trend, and taking the new ozone NAAQS into account, we predicted about 18-22 exceedance days in Philadelphia and 6-8 days in Delaware for the 2016 ozone season. Exceedance days occur when observed 8-hour average ozone is ≥ 71 ppbv.
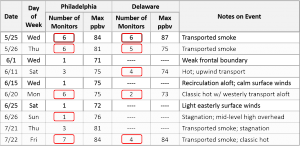
Table 1 (click on table to enlarge) shows that we are well behind our predicted average for 2016 in Philadelphia (10 exceedance days so far) but just about on pace in Delaware (5 days so far). The red rectangles in Figure 1 indicate the days for which we correctly forecasted the ozone exceedances. We are doing really well in Delaware, having correctly identified all of the exceedance days so far this season and issuing only three false alarms. (To be fair, I should acknowledge that officially, there have been two additional exceedance days in Delaware, but they were what Bill and I consider technicalities, in the sense that they were validated at one monitor with only 6 continuous hours of data. While these two days technically count as exceedances from a regulatory standpoint, I contend that they don’t count from a health/forecasting perspective.)
In Philadelphia, however, we are not doing so well; we have only identified half of the exceedance days. Note that three of the days we missed were localized events (June 1, 15, and 25), with only one monitor exceeding by a few ppbv, driven by mesoscale weather conditions that are inherently difficult to predict. The exceptions are June 11, when we had high ozone transported from upwind on the first 90 °F plus day of the summer (see my previous post), and July 21, when transported smoke and local stagnation combined to push observed 8-hour ozone up to 81 ppbv, with exceedances at three monitors. The other main problem in Philadelphia is that we’ve issued a whopping seven false alarms, most of which have been epic fails (7-11 ppbv too high).
The five missed exceedance days and preponderance of false alarms in Philadelphia underscore the challenges of identifying which days will be high ozone days. Concurrent with the recent drop in observed ozone beginning in 2013, we’ve seen a shift in the main meteorological factors that lead to high ozone. Historically, high ozone days in the Mid-Atlantic were characterized by synoptic conditions including hot weather (Tmax ≥ 90 °F), westerly transport aloft from the Ohio River Valley, a strong ridge of high pressure aloft, and slowly migrating high pressure at the surface. These conditions led to more widespread, multi-day high ozone events. So even if we missed the onset day, we could reasonably forecast the remaining days in an event. Now, high ozone days are driven primarily by mesoscale features, such as weak frontal boundaries, stagnation, and bay/sea breezes. We still seem to have a few days that fit the more “classic” mold, such as June 20 and July 22, but they tend to be single day events. And by no means is hot weather a guarantee of high ozone anymore… for example, we had an extremely hot July, but only two exceedance days in Philadelphia and one in Delaware. We haven’t had an exceedance day in either forecast area in the past month, despite persistent above average temperatures during most of that period. And both of the exceedance days in July were influenced by transported wildfire smoke, which seems to be the real wild card in recent years. At least for Philadelphia and Delaware, the highest ozone we see now is associated with transported smoke, such as on May 25-26 and July 21-22. Yes, July 22 was influenced by “classic” hot conditions, but ozone reached up into the low 80s ppbv (instead of peaking in the 70s ppbv) due to the presence of smoke.
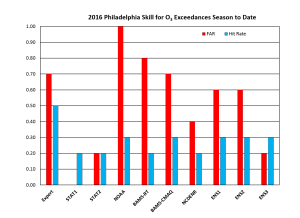
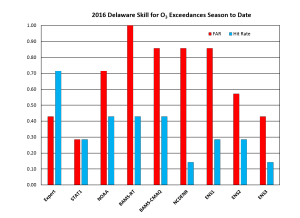
And we can’t rely on the air quality models to help us identify the exceedance days. Figures 1 and 2 (click on figures to enlarge) show the skill scores (hit rate and false alarm rate) for ozone exceedance days in 2016 for Philadelphia and Delaware, respectively. You’ll notice that across the board, the false alarm rate is higher than the hit rate for all of the numerical model guidance, and the “expert” forecasts have higher skill than any of the model guidance. Also included in Figures 1 and 2 are the skill scores for our updated statistical models, which include variables such as maximum temperature, surface wind speed in the morning, and relative humidity in the afternoon. Due to the lessening influence of synoptic weather conditions, the updated statistical models are not really helping us much this year, either, although they have some promise for helping to avoid false alarms.
The take home message is that the recent “step-down” in observed ozone seems to be here to stay, and it is not an anomaly due to fluctuating meteorological conditions over the past three summers. We can presumably look forward to a continuation of fewer ozone exceedance days in the next few years, relative to the 2003-2012 average. At the same time, correctly forecasting these days remains more of a challenge than ever, due to the weakened correlation between hot weather and high ozone, as well as the shift to predominantly mesoscale-driven ozone conducive conditions.

Table 1. Observed ozone exceedance days for the 2016 season to date in the Philadelphia and Delaware forecast areas. The red rectangles indicate days when the exceedance was correctly forecasted.

Figure 1. Skill scores for ozone exceedances for the Philadelphia forecast area. The best hit rate is 1.0 and the best false alarm rate is 0.0. The numerical ozone models include “NOAA” (NOAA-EPA model), “BAMS” (Barons Meteorological models), and “NCDENR” (North Carolina model). “STAT” refers to statistical models, and “ENS” indicates various “ensemble” averages of different combinations of the numerical and statistical guidance.

Figure 2. As in Figure 1, but for the Delaware forecast area.

