

Ozone exceeded the 70 ppbv NAAQS on Saturday, June 11 along a swath of the central I-95 Corridor, including northeastern Maryland, the eastern shore of Maryland, northern Delaware, northeastern metro Philadelphia, and central and southern New Jersey (Figure 1). A warm front lifted across the northern Mid-Atlantic region in the morning, ushering in a hot, humid, and modified air mass (Figure 2). It was the first 90 °F plus day across the I-95 Corridor, with a high temperature of 91 °F at KPHL and KDOV. The air mass was modified, with 24-hr back trajectories for KDOV ending at 12 UTC on June 11 (Figure 3) showing transport of air from locations where ozone reached the USG range on June 10 across NC and OH (Figure 4). As a result, we issued an AQA alert for a USG ozone forecast for Delaware on Saturday; all four of the northern Delaware ozone monitors exceeded, with a maximum 8-hr average observation of 74 ppbv. We kept the forecast in the upper Moderate range for Philadelphia because convection was expected to develop in the afternoon (Figure 5). This convection never materialized, so Philadelphia received full strong June sun all day. The surface winds were breezy, but they were southwesterly, so all they ended up doing was pushing anthropogenic emissions from I-95 to the three northeastern Philadelphia monitors, which all exceeded, with a maximum 8-hr average observation of 75 ppbv.
There are a couple of really interesting things to note for the June 11 exceedances. First, for both Philadelphia and Delaware, the previous day’s (June 10) observed ozone was in the Good range (8-hr average max of 46 ppbv in Philly and 52 ppbv in Delaware) due to the influence of a very clean air mass under northerly flow. Historically, it is extremely rare to go from Good to USG the next day. The second aspect of note is that all of the air quality models missed this event. The NOAA model guidance (Figure 6) is a representative example – the locations of highest ozone aren’t even correct, let alone the ozone magnitudes. For this event, upwind persistence was the most useful forecast variable.
So, the good news is that our hit rate for Delaware is 1.0 – we have correctly forecasted all three ozone exceedance days in Delaware (May 25-26 and June 11), with health alerts issued to the public. The bad news is that our hit rate is only 0.5 in Philadelphia – we missed two of the four observed exceedance days so far (June 1 and 11). In retrospect, the “forecast of least regret” for Philadelphia on June 11 should have been USG – we probably should not have counted on convection to develop, since the model guidance had been inconsistent leading up to the event. But the 12 UTC hi-res guidance was compelling enough (Figure 5) to convince me to keep ozone in the upper Moderate for Philadelphia.

Figure 1. Observed ozone AQI values for Saturday, June 11.
Figure 2. WPC surface analysis with observations and fronts for Saturday, June 11 at 21 UTC.
Figure 3. 24-hour back trajectories ending at KDOV on Saturday, June 11 at 12 UTC.
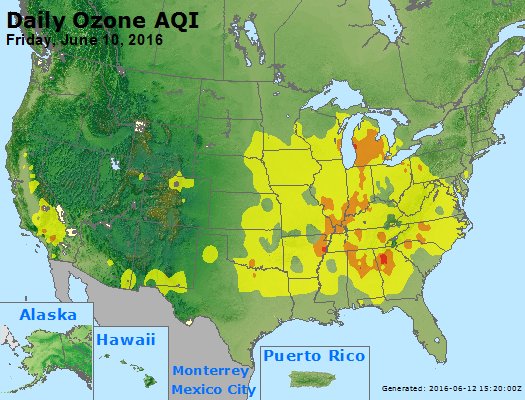
Figure 4. Observed ozone AQI values for Friday, June 10.
Figure 5. Precipitation guidance from the 12 UTC run of the 4 km NAM model for Saturday, June 11 at 22 UTC.
Figure 6. 8-hr average maximum ozone guidance for Saturday, June 11 from the 12 UTC run of the NOAA model on June 10.