

By the time we reached the Independence Day holiday weekend, we were overdue for an ozone exceedance day (8-hour average O3 mixing ratio > 75 ppb) in the Philadelphia metropolitan region. This is climatologically the height of the ozone season, when the days are long, the solar zenith angle is short, and daily air temperatures are typically at their peak. Philly has had only one ozone exceedance day so far this summer, however (June 11). This is the farthest we’ve ever gone into the summer without a second exceedance day, even during the recent historically low ozone years of 2013 and 2014. In 2013, we had 1 exceedance day in May and 2 in June, while in 2014, we had no exceedance days in May but 2 in June (Figure 1).
In the week leading up to the Independence Day holiday weekend, the forecasting interns and I had identified Sunday, July 5, as a day of interest for a possible ozone exceedance. The axis of a narrow and fast-moving ridge of high pressure aloft (Figure 2) was forecasted to be just to the west of the Mid-Atlantic, the prime spot for ozone formation. The corresponding center of surface high pressure was forecasted to move across southern PA during the day, promoting sunny skies and calm winds (Figure 3). The main limiting factors were persistence – observed ozone on Saturday was in the Code Green (Good) range across the region – and the fact that it was a Sunday. Historically, lower emissions of ozone precursors on Sundays tend to limit ozone to the upper Moderate range, even when weather conditions are favorable for rising ozone.
All of the air quality models blew up ozone to the Code Orange (USG) range on Sunday (Figure 4). They had excellent consensus with each other and over several consecutive runs (Friday afternoon to Saturday morning). When the air quality models all agree on the location and magnitude of USG ozone, I pay attention. Given the synoptic and mesoscale weather conditions, pockets of USG ozone certainly seemed possible along I-95 from Washington, DC to Trenton, NJ, but I decided that the low regional and upwind ozone on Saturday (low persistence) and the fact that it was a Sunday – even a holiday Sunday – would be enough to limit rising ozone to the upper Moderate range. I thought there was a small chance for isolated USG, but I wasn’t confident enough to issue a USG forecast and call for an Air Quality Alert (AQA). So I forecasted at the top of the Moderate range (74 ppb) for Philadelphia and Baltimore and upper Moderate for DC and Delaware (70 ppb).
It was fascinating to watch the hourly ozone observations come in on Sunday afternoon. Although it was sunny with very light surface winds (Figure 5), 8-hour average ozone stayed in the Good range across Maryland and northern Virginia and barely made it to the Moderate range in northern Delaware (63 ppb). But along a very short section of I-95 in Philadelphia, ozone quickly jumped up at a couple of monitors – Northeast Waste in Philadelphia County and Camden Spruce in Camden County (Figure 6). We ended the day with those two Philly metro area monitors just reaching the USG range for 8-hour average ozone: 76 ppb at Northeast Waste and 78 ppb at Camden Spruce.
This same thing happened last summer – in fact, 3 of the 6 exceedance days in Philadelphia last year occurred under almost exactly the same weather conditions, with Code Green ozone on the previous day, and only 1 monitor reaching USG by 1-2 ppb. So Sunday was not unprecedented, but it was nearly impossible to forecast. I don’t think I could have realistically issued an AQA for the Sunday of Independence Day weekend with the expectation that 1-2 monitors would hit USG by 1-2 ppb. I’m also not sure I could have issued a lower forecast for Maryland… possibly I could have gone lower in the Moderate range, given that it was not forecasted to be as hot, with high temperatures only in the low 80s °F. But I certainly did not expect widespread Code Green ozone (Figure 7)!
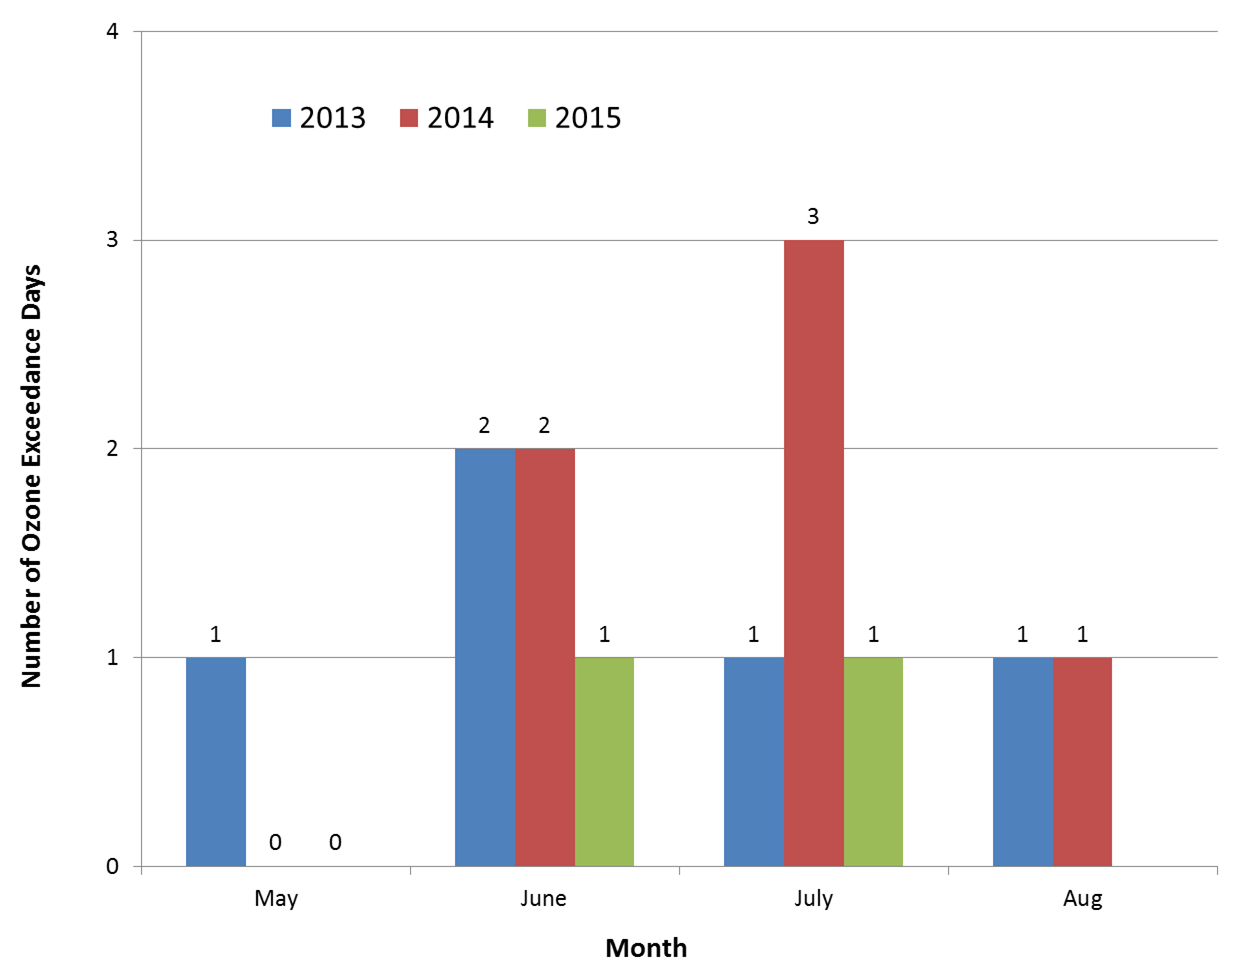
Figure 1. Number of observed ozone exceedance days in the Philadelphia metropolitan area by month for 2013-2015.
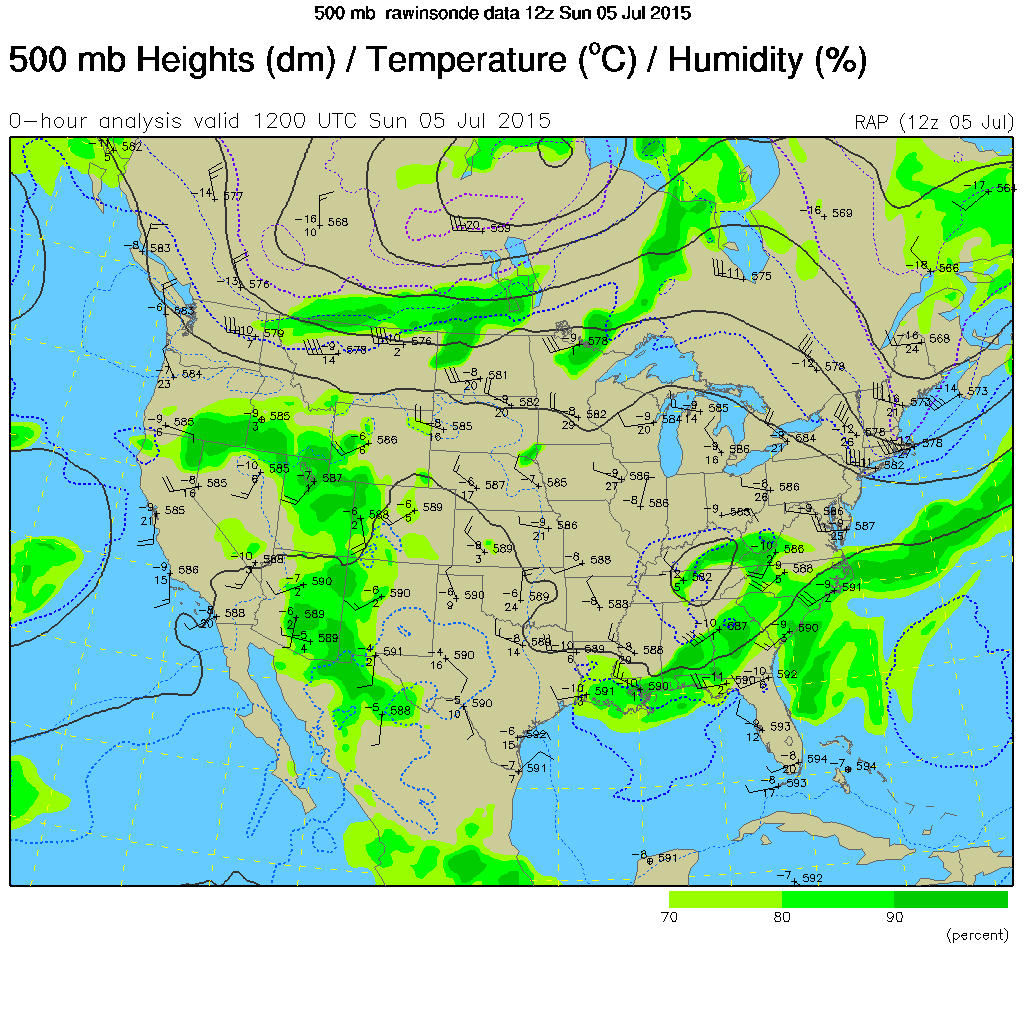
Figure 2. 500 mb geopotential height analysis at 12Z Sunday, July 5, showing ridge axis to the west of the Mid-Atlantic.
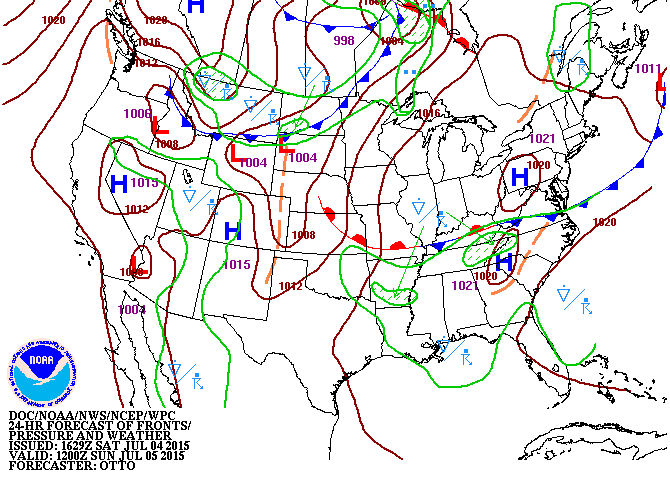
Figure 3. WPC surface analysis forecast for 12Z Sunday, July 5, showing the center of surface high pressure over western PA.
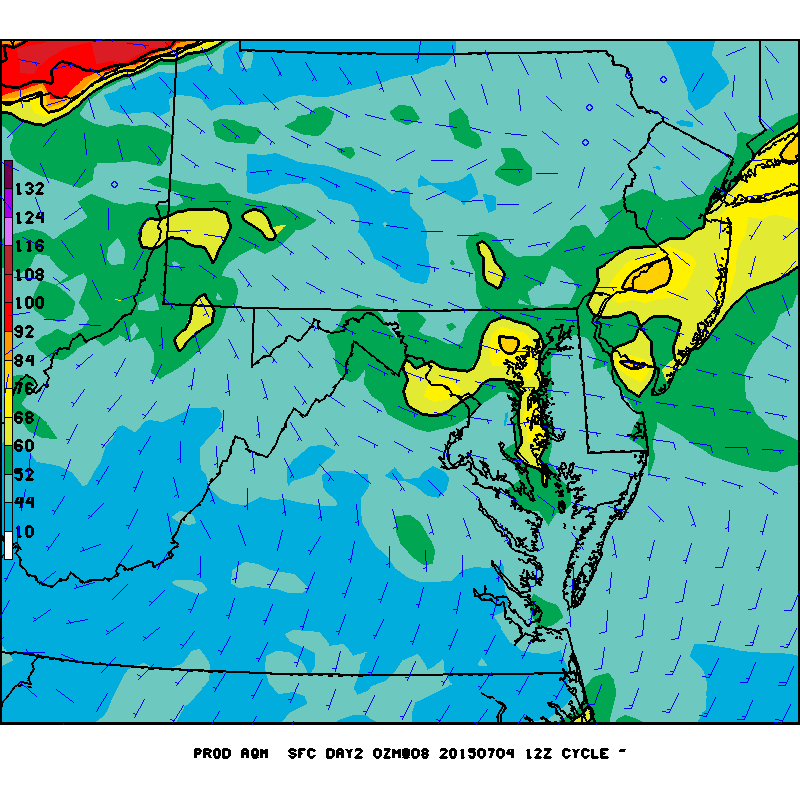
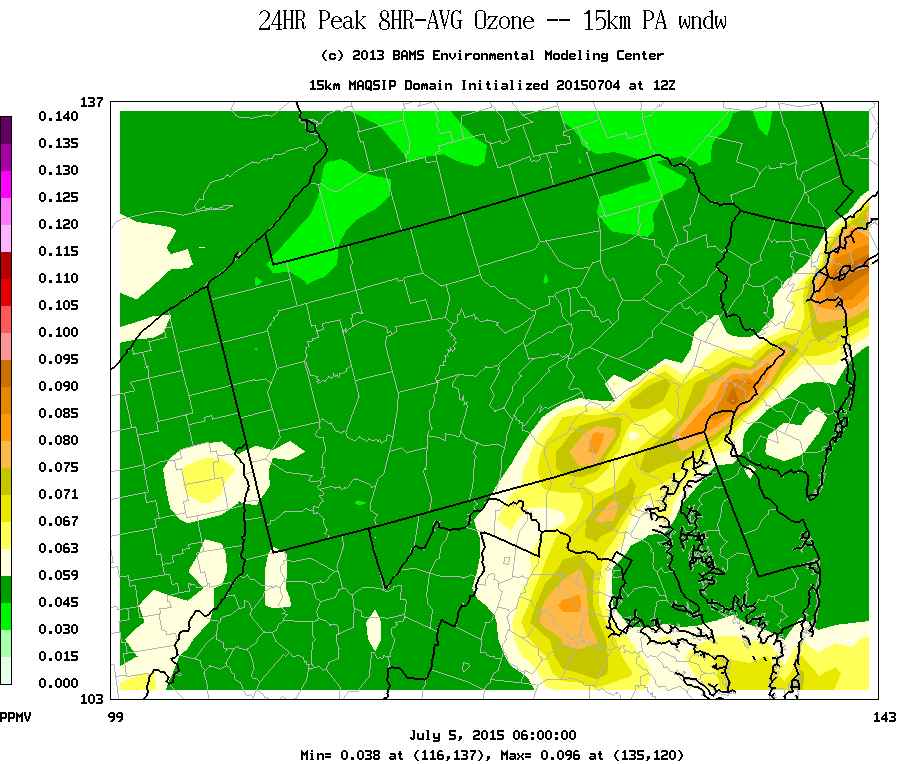
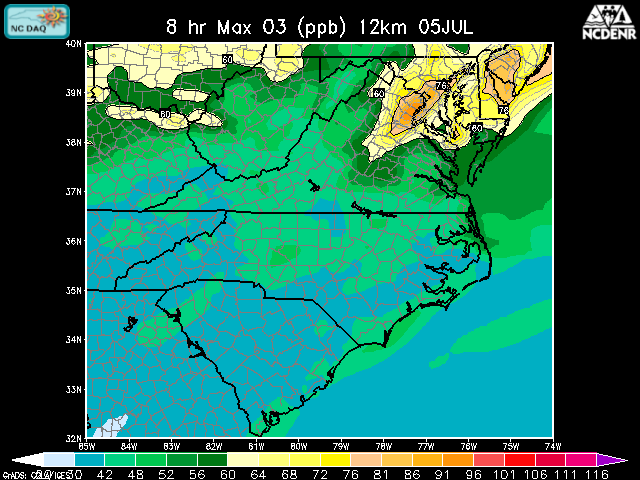
Figure 4. 8-hour average ozone forecast guidance for Sunday, July 5 from the 12Z runs of the NOAA/EPA model (top), BAMS-MAQSIP model (middle), and NCDENR model (bottom).
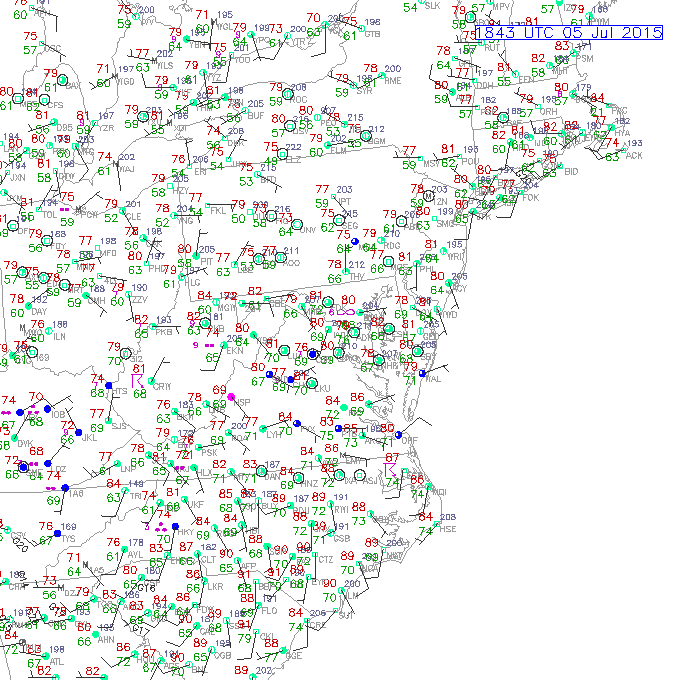
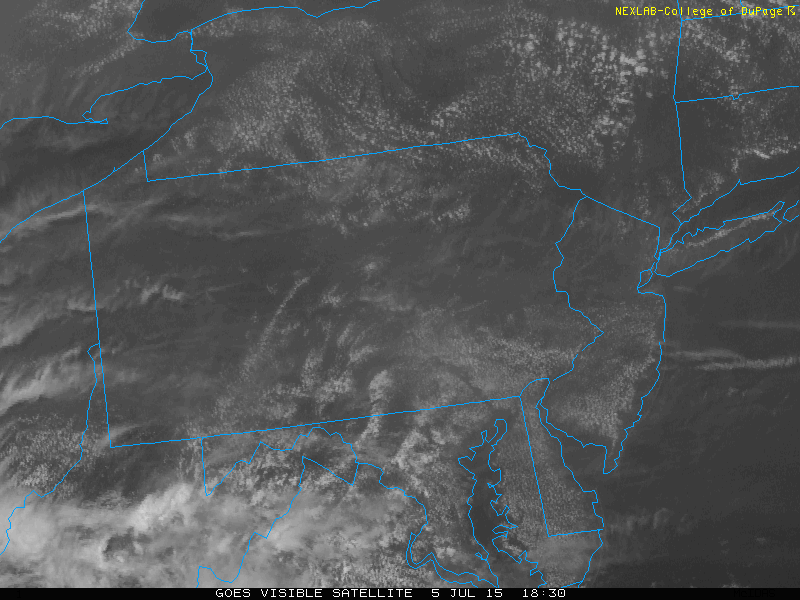
Figure 5. METARS surface observations at 18:45 UTC (top) and GOES visible satellite image at 18:30 UTC (bottom).
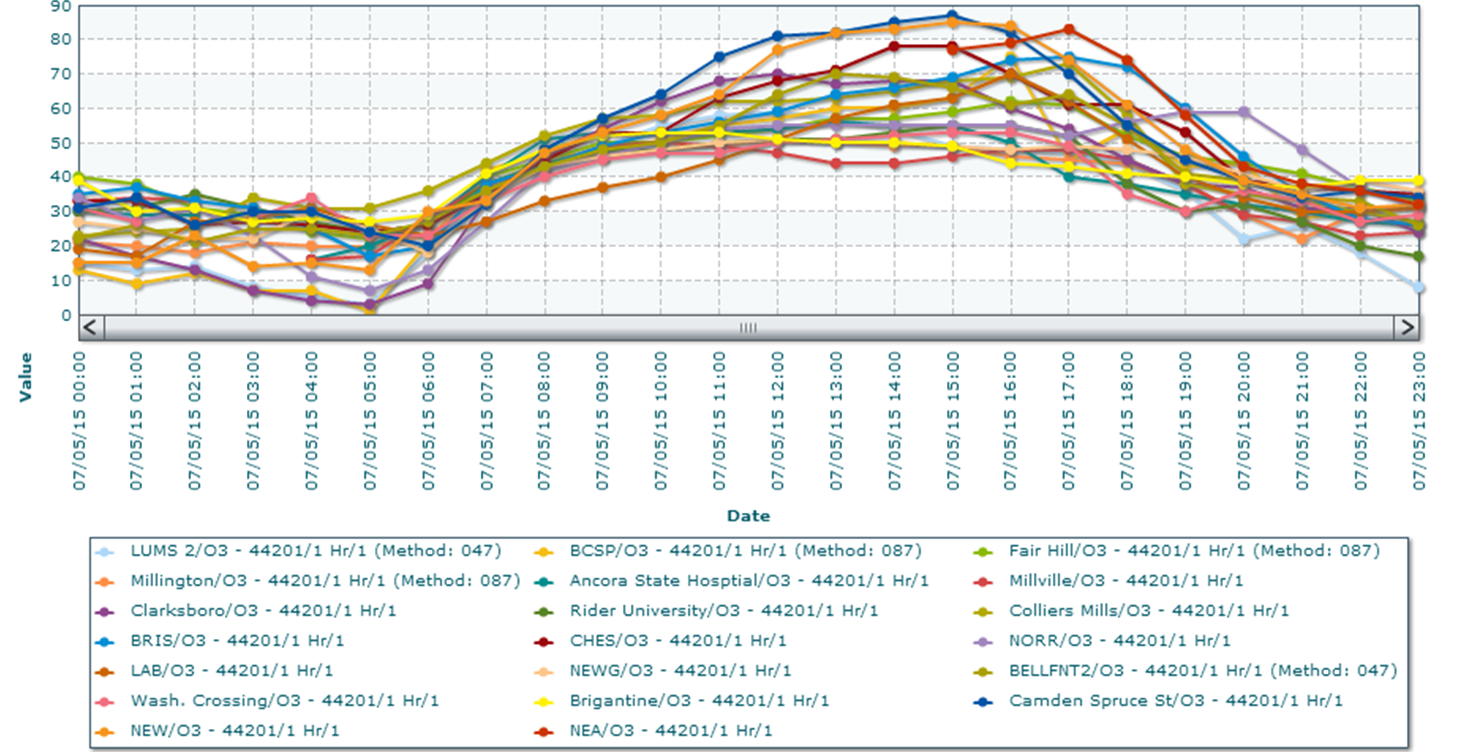
Figure 6. Time series of hourly ozone observations for the Philadelphia/Trenton/Wilmington metropolitan region for Sunday, July 5. Note the topmost lines for Camden Spruce (dark blue) and Northeast Waste (NEW; orange).
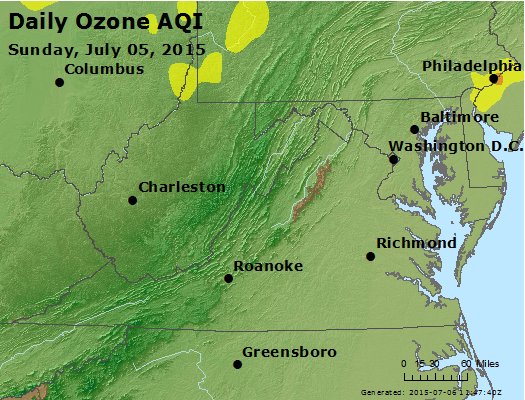
Figure 7. Observed ozone AQI color codes for the Mid-Atlantic region for Sunday, July 5.